Turn Analytics Into Action With NoPileups™

August 02, 2023

In this webinar, we’ll show you how to use NoPileups reporting and analytics to optimize your tunnel. Learn how to analyze vehicle spacing, downtime and stop data in your tunnel, plus identify sites that are setting the bar or underperforming so you and your team can take action to maximize site performance.


Transcript

Alex Mereness, Director of Product Management: All right, well, hey, thanks again for everybody jumping on, taking some time out of your day. We're really excited about this webinar. Going to be a great chance to talk about NoPileups and really get into how to turn our analytics into to action. A few housekeeping items that we want to toss out before we get started here. The chat button is disabled, so if you do have questions, hit the Q&A button at the bottom of your screen and you can type your question there. If you don't see the QA button, try clicking the view options.

And then if you exit full screen, you'll put the webinar into a smaller window and you should see the Q&A option there. If you run into any technical issues, we do have a team that will be monitoring our Q&A so you can just let us know and we will work through it with you. We will also have some time afterwards to address any of the questions that may be popping up throughout the webinar. We'll make sure that we set aside some time for that and answer as many as we can. My name is Alex Mereness. I am Director of Product Management for Tunnel Solutions. Again, really excited to be here. I got my co-pilot, Dan, I'll let you introduce yourself here.


Dan May, Operations Manager, NoPileups™: Hi folks. I'm the Operations Manager for NoPileups here at DRB. Really excited to talk with you today more about NoPileups and how the reporting can work better for you.

Alex: Perfect. Intros are out of the way. So for those of you who are new, you know, maybe don't have NoPileups currently are curious about the product, what it is, how it works? NoPileups is a patented full tunnel anti-collision system that really is more than anti-collision. We'll get into that, but it allows you to optimize your wash operations by allowing you to run more cars, but really also provides a level of safety. It will measure the difference distance, excuse me, between your vehicles triggering emergency stops when we detected a vehicle is getting too close. A good example of this is this video here off to the right hand side. You'll see there's kind of a lot going on. You see a lot of the green dots and I'll give you kind of a high level overview of what's happening. So NoPileup uses IP based security cameras that are strategically placed throughout your car wash tunnel. And we are tracking vehicles from the entrance to the exit of the tunnel. All the green dots we call those flow points.

People tend to ask about those. That's getting way in the weeds of the technical details, but ultimately what we're doing is we're measuring the distance between vehicles and as they get close to each other or risk is detected, or the vehicle isn't moving at the rate of the conveyor or isn't what we expect it to be, we'll trigger an emergency stop of the conveyor. So this video that you're seeing here is a vehicle, the front vehicle there it hops a roller, NoPileups detects that it hops a roller and ultimately calls for a stop of the wash. Highly customizable. You know, as you can imagine, because we are watching every vehicle that goes through, there's a decent set of data that we're able to collect and analyze based off of that and provide that back to you as an operator. And again, that ties right into the operational insights that you gain with our product. One of the key features with NoPileups is our Smart Exit solution.

For those of you who are currently in the industry and familiar with the Anti-Collision pad, NoPileups Smart Exit is similar, but I like to say that it's a lot smarter. It's a lot more intelligent than an anti-collision pad. Typically with your AC pads or anti-collision pads, they are, you know, maybe two by two, they're on the floor at the end of your conveyor. Sometimes they can be difficult to adjust and you know, it's really just not a very intelligent way to monitor the exit. So with Smart Exit, we're able to use, again, computer vision with an IP based camera and monitor vehicles as they exit the wash, identify if they stall at the wash. So this is a great video where you see that white vehicle there that, you know, doesn't pull out in time when NoPileups is able to detect the approaching blue vehicle, identify that they're getting close where there's a risk and then call for a stop.

The neat thing with Smart Exit is as that vehicle pulls out, we'll automatically turn back on the conveyor. You know, one of the highlights to Smart Exit there is the amount of con, excuse me, configuration that we can add. You know, if you have a tight egress, we can make it so vehicles get a little bit closer. If you have less of a tolerance for getting those vehicles that close, maybe it's a little uncomfortable for you. We can also dial back the settings. There's a whole number of settings that we can manipulate to dial in the system to each site's use case. This is where I kind of get excited. We start talking about the reports with the NoPileup system, if you are currently subscribed to the service, part of that is getting our analytics, like I said earlier, we are monitoring every vehicle as it goes through the car wash tunnel. We're able to take measurements all over the place, distance between vehicles, the speed of the conveyor, and we'll get into all of these different things, but there's tons of information that we're able to provide you.

And a lot of what this webinar is going to be based around is how to maximize, you know, the information, how to really use the information that we're providing you to maximize your throughput, decrease your downtime, you know, analyze the vehicle spacing. Are you loading vehicles as close as you could load them with an NoPileup system and still being safe when there is an NoPileup stop? Understanding why we're stopping? What's our risk, right? What's causing the stop? And one of the neat things and again, we'll get into this as we dive into the reports, but really the ability to compare one location's performance to another location's performance within your organization. And then also throughout, compare that to the carwash industry as a whole. So let's go ahead and let's dive in here.

Maximizing throughput. So one of the charts and, you know, our goal is really to take each one of the charts and kind of dive into them and highlight some of the insights that you can gain from that chart. Just to kind of level set. There's a few things going on here that you probably see. Dan, can you walk through and just kind of explain to us the different what do the bars generally mean?

Dan: Sure.

Alex: What's there's a lot going on in the graph. Do you want to?

Dan:They are pretty dense. So, let's break this down piece by piece. So for starters, we've got those vertical colored bars. The blue bar is going to be data for the current week. The orange bar is going to be data at the same site or the same time period the previous week. So on every single chart that NoPileups reports offers, you can immediately see what is my change, this report week compared to the week before. Are we trending up? Are we trending down? You can really easily see what the direction the numbers are going there. We've then got some horizontal lines.

So first we'll talk about those solid orange and solid blue lines. This is if you have multiple sites in your organization that have NoPileups. In addition to providing you the numbers for individual locations, we're also going to give an average for that data point across your entire organization. So in the chart in the back there, we can see that we've got averages across your organization for the orange line being, again, the previous week and the blue line being the report week. We've got two additional lines that are on the chart. You can see them there. They're the turquoise and the green dash lines. We're pretty excited about those. Those lines reflect the industry average for the data points. That is to say what is the industry in general doing? It makes it easy for you to compare how is my site or my organization stacking up compared to the rest of the industry and give you a good feel for, is this good? Or maybe there's some room for improvement here.

Alex: Yeah. So just, Dan, just briefly wrapping that up. This really gives you the ability to compare week over week. How you're doing? It allows you to compare your organization or your locations to an industry average and then we will get into the side by side site comparison as well. So, Dan, as we talk about conveyor utilization this seems like an interesting chart. What exactly does it mean? What are some of the benefits that an operator can get? What are the insights an operator can get from a chart like this?

Dan: What conveyor utilization is really trying to drill down into is maybe I feel really busy at this location. It seems like those guys are just busting their butts all day long. But are we really maxed out? Have we hit the physical limit to what we can run through there? Or is there still an opportunity to run more vehicles through? So a great example is looking at both of these charts, understand that conveyor utilization is generally speaking, not near a hundred percent. So where these numbers really come in and add value is seeing how different sites compare to each other or how a site on a particular day compares to the rest of your org or the industry as a whole. And use that as a benchmark and say, well, the average for most across the industry is about 30% on a Thursday, and maybe I'm hitting 35. That sounds like that site is running brisk volume.

The other thing to think about as you're looking at these charts, and we do this across all of the charts in the NoPileups reporting, they're meant as a starting point to jump into a deeper analysis of your operations and the things that your organization is doing. So one thing that I think about when I'm looking at these charts is you see the high performers, you see the ones that might not be doing as well, you really got to think is the way that we're doing things holding us back from running additional cars? You know, maybe there's improvements we can do with how we handle cars at the XPTs. Maybe it comes down to the load on process, but trying to draw correlations between the data and what the day-to-day processes are at each one of these sites.

Alex: Yeah, that's a just a fantastic point, right, Dan, being able to step back and ask yourself, is there anything that could potentially be holding us back? Whether that be process people what have you, conveyor speed, all of those things. So when you take a look at a chart like conveyor utilization, understanding, you know, what's my current rate at running vehicles and how does that align with the industry? And better yet, how do I set benchmarks using this KPI for my team? Some good insights there. Average gap at peak traffic. This is honestly based on what we've heard from our customers, this is one of their favorite charts. I get excited about this on. I think that people often appreciate this chart because of, what it indicates, Dan, what does this chart mean? How do I use this to my advantage? What is it trying to tell me? And how do I turn that into action at my site?

Dan: Absolutely. So one thing to understand is these charts at their core is understanding during the busiest times of day at each one of the washes in the organization, how close are vehicles being loaded? So it's not taking into account what the spacing is like during the really slow times of day, you know, early in the morning, late at night. This is only looking at those times when you're at peak or 80% or closer to peak. But the general idea is when we're running a lot of cars at this site, how close are they from the rear bumper on the front car to the front bumper on the rear car? And this is one of those metrics where a lot of operators have real pride in their operations and they say, man, you know, on Saturdays we are just loading those cars literally bumper to bumper. I can't get my hand in the middle of there, we are maxing things out. And when we take a look at the actual data from NoPileups across those busier days like the weekends, and we also look at maybe slower days, like during the week, sometimes those draw conclusions that make us step back and go, wow, that's really not what I was expecting. My fields don't really match what the data's saying. It gives us a real opportunity to get benchmarks that we can judge for improvement across.

Alex: Yeah, I mean, Dan, I think you hit a really important topic there, right? There's the assumption that I, as an operator, I've set my policy, I have this expectation with my team on how closely we're loading vehicles and either my assumption or my gut is telling me that we are loading them as close as we can possibly load them and we are loading them according to, you know, our best practices or our policy. When you take a system like NoPileups, which is taking its own measurements, right?

And telling you this is what the actual distance between vehicles is, you take away the assumptions. You take away, you know, the gut feels, and again, now you have a metric that you can rely on that's being measured in the same way every time. And you can work off of that as a starting point for improvements. Understanding where you might be, you know, not as efficient as you could be.

Dan: It's basically impossible to improve something without having hard data around how you're actually performing. And this is one of those ways that you can really drive impact across your wash, even if you only have one location or if you have 5 or 10. This is another one of those things too, where if you see really consistent gaps at peak traffic across the days or across different locations, that's when you can start thinking about what is limiting that spacing, right? Is that my comfort zone? That's where I want it to be? Or maybe it's farther apart than I would like it to be and we need to do a little bit to maybe optimize those load on procedures and give customers a little bit clearer guidance about what to do. Maybe it's-

Alex: Then it could also be training, internal training opportunity, right?

Dan: Yeah.

Alex: Maybe I noticed that it's on every Tuesday and I have specific people staffed on every Tuesday, but our gap between vehicles seems to be a lot greater than what we'd be looking for. That kind of an inconsistency would jump out. And I think that it lends itself to opportunity for working with your team members to identify what may be happening there.

Dan: Yeah, exactly. And when you look at this chart and it says, you know, on average on a Saturday we're loading cars 25 feet apart. Maybe that's the moment when you're like, is the roller spacing the thing that's holding us back?

Dan: Is there something other fundamental that we can change to try and take our production at peak times to that next level?

Alex: Well, Dan, and what's the advantage to us specifically calling out peak your peak traffic hours?

Alex: Right?

Dan: Sure.

Alex: Why is it not all hours? Why do we specifically call out your peak traffic hours here?

Dan: Well, I think when we look at data like this oftentimes, we all know that there are really busy times at the car wash and there are really slow times at the car wash. And if you get data like this where you're taking data from any time of day, any day of the week into account-

Alex: Yes. Yeah.

Dan: Those averages are going to feel much less useful because those slow days and times are dragging down those peak days at times. And by just focusing on a small subsection of this that allows us to go, no, that's not influencing this data. This is saying when we're running a lot of cars, this is what we do. 'Cause when you're running a lot of cars, that's when the spacing really counts and it can help you move that line.

Alex: Yeah, I mean, it's when it matters the most, right? It's when you have the most opportunity for that, you know, the customer would be customer that drives by, looks at the line and says, "Oh boy, that's a little long, maybe longer than I want to wait." It just again, highlights the importance of looking at the data when we are at our busiest versus trying to evaluate the data when we are at our slowest, right? So I think that there's great opportunity there and good learnings just by sticking with the peak traffic hours. What are we doing in terms of vehicle spacing? So next on we'll move to conveyor speed. So Dan, I know, you know, in most operations you have probably a handful of different systems where you can get your conveyor speed.

Dan: Yes.

Alex: In the NoPileup's world, why is this useful? How can I leverage this? What is this telling me that I maybe don't get from my tunnel controller or other systems in my operation?

Dan: I think when we talk to a lot of operators, the thing that they keep coming back to is I want to ensure consistency between days of the week between locations. I want to make sure, especially if I have these unlimited customers who can go to any location, I want to make sure they can go to their normal wash down the street, or they can go to the wash across town. They know exactly what they're going to get. They're going to feel really great about the experience they're going to get, and that's going to be a positive thing that reinforces their membership. And one of the things that people do actually, actually notice is like, how fast am I moving through the carwash, right? Do I feel like I'm going slow and I'm getting a really thorough clean, maybe I'm zipping through.

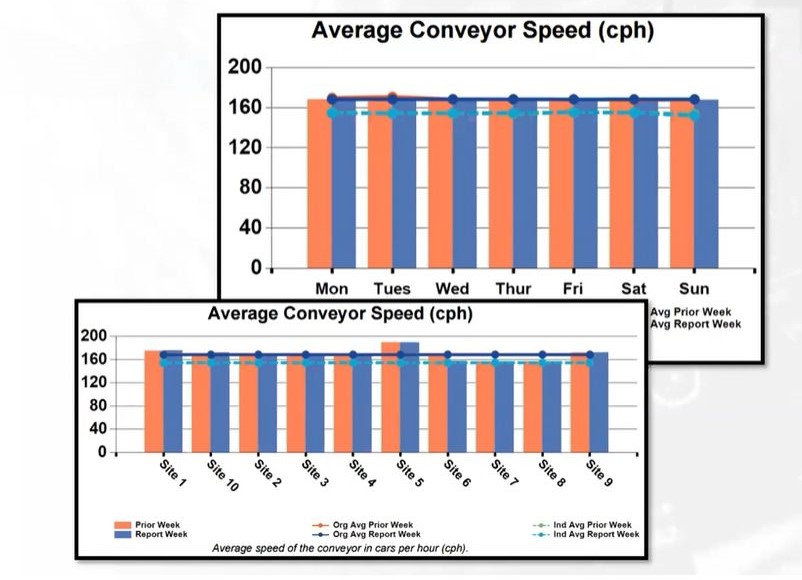
So, the baseline thing that these charts can give us, especially for multi-site operators, is just understand, do we have consistency across the org? Do we maybe have some locations that run higher than average conveyor speed? How are they doing that? Is that intentional? Is that something we could scale to the other locations so that we get the added throughput benefits across our organization instead of at that one location? One other thing is you can understand, hey, where are my standards at compared to the rest of the industry? I mean, I know that we can talk with other people and get a feel for what they do, but this gives us a really unbiased idea of where am I at? How do I compare to the average? I mean, if we look at that bottom chart there, you can see that site five consistently, both the report week and the prior week, conveyor average conveyor speed is higher than the rest of the locations. So my question would be, what is the thing that they're doing differently that allows them to do that? And can we scale that elsewhere?

Conversely, you have site six where they were pretty in line with the organization average, but then on the report week, their average conveyor speed dropped while the conveyor was running. So my question would be, was there a maintenance issue? Was there something unexpected that we knew about that's going on there? Or is that an underlying issue that we maybe hadn't caught previously that we need to address so that we can get our conveyor speed back up and running and we can run that many more cars through that wash.

Alex: Dan, you had mentioned the consistent experience in standard setting across an organization, you know, and I just want to highlight here, and I know for those of you who are online, some of these images are a little bit small, but that bottom graphic there where you can see that it has the site labels, just a perfect example of if I'm running my organization and I look across the board, I can see the conveyor speed is consistent except for, you know, site five, for example, it stands out like a sore thumb. So if I'm looking to provide a consistent experience and I have, you know, defined expectations for what conveyor speech should be throughout my organization, I now can identify that site five is out of that range.

And we can begin that investigation of working with the site to figure out, why is your conveyor speed not in line? And kind of work backwards from there? So that's a great point. Vehicles washed. Another chart where I think that, for most they can get this information from their point of sale, they can probably get it from their tunnel controller. Dan, how does this fit into the NoPileups world? I'm an operator. Is there something that I can glean from this vehicle's washed data and how is that of use to me?

Dan: The huge thing here is the ability to compare and see trends. So I can easily see, hey, we had a better week this week than we did last week. Or I can compare my sites side by side and say, quickly say, wow, these sites are above average, they're doing great, these sites are below average. Maybe they need a little bit more operational focus. Let's let's try and bring them up to snuff.

You know, either maybe they need a dash more marketing, maybe they need a little bit of excellence in order to run those additional cars. But you can quickly, at a glance, compare both diving deep into a single location and see how they're doing week to week, but also just looking across your whole organization and seeing where those rock stars are.

Alex: Yeah, again, I think, you know, once again, it really comes down to the ability to look across my organization, right? Doesn't matter what point of sale you have. It doesn't matter what tunnel controller you have. It doesn't matter if they're all consistent or they're all different. With the NoPileup system, it gives you one single place where you can look across your organization, do a very quick comparison as operators, site managers, area managers, and so on. You only have so much time in the day, right? So where do you focus your efforts? How are sites performing? Which sites do I give a little bit more care and attention to, you know, to get them up to the standard. So just the ability to do that side by side comparison again is just great here.

Dan: Absolutely.

Alex: Minimizing downtime, this is probably one of my favorite sections, minimizing downtime. Then we have another section. You'll hear me say that on. I get excited about the data, so you're probably going to hear me say that a few times. They're all my favorite, but we'll jump in.

Dan You can have multiple favorites.

Alex: I'm going to take that. I'm going to have multiple favorites here. So, you know, here's the thing with downtime. It's not all created equal. I think it's a generic term, in the way that NoPileups addresses downtime, you're going to see that for us, it's important to really get you to understand where your downtime's coming from. So and we have a couple different graphs here. The next slide we'll go into that, but just starting here, we're looking at average downtime per day. Dan, again, I'm going to ask you what am I looking at here? Why do I care?

Dan: Sure.

Alex: How does it help me? What's in it for me as an operator investigating things like downtime and where it's coming from and all those things?

Dan: Well, I think the first thing we need to talk about is what do we actually mean by downtime? So when we're looking at downtime in this chart, that means that the conveyor was stopped and there are two or more vehicles in the tunnel. So this is not, it's a slow Tuesday and we don't have anybody in the wash and it turned off. This is, we've got multiple cars in the tunnel, probably more than two in most cases. So we're impacting the customer experience and we're also reducing the number of cars we can run that hour.

Alex: So Dan, that's a really important point, right? When we talk about downtime, the charts and the way that we are analyzing this data and displaying it to you is we're specifically honing in on this is downtime when you have vehicles in your tunnel, right? So to Dan's point, it is now impacting the customer experience. For those that are outside the car wash industry, being in the middle of a car wash, having the equipment turn off, you know, the tunnel light up and your car stop. It can be a little bit jarring. You're looking around, you got soap on the windows trying to understand, you know, what's going on? And that's not even to get into just the hit to operational efficiency. Now, my conveyor's turned off. If my conveyor's turned off, you know, I have risk of losing revenue there. There's money on the line.

Alex: So, yeah.

Dan: Well, and I want to point out that this is irrespective of the reason that the conveyor stopped. So this could be somebody hit a e-stop button. This could be NoPileup, stop the conveyor. This could even be the conveyor stopped unexpectedly and nobody triggered it manually. This is any time when the conveyor stops and there are two or more vehicles in the tunnel.

Dan: As we jump into a little bit more detailed data, just kind of different ways to look at this, in addition to the downtime itself, which we measure in minutes because we want to understand, you know, a bunch of little conveyor stops are not as much of an issue. What really kills us is when we have individual stops that are for long periods of time. And that adds up to real impact to the customer experience and real impact to our bottom line of we could have washed 10 cars in that 10 minutes that we were down, but we didn't. What can we do to push that a little bit more?

Alex: Yeah, Dan, I mean, and you touch on it, we've had experiences in the past where we've worked with customers to try to help them identify where their downtime's coming from. And these charts are just, I mean, this is pretty much what we lean back on, right? Working through this and understanding that there are different types of downtimes, you know, downtime, where is it coming from? And one of the things that Dan kind of touched on at the beginning is, you know, the NoPileups reports are really just the beginning of that investigation, right? It's putting the data in front of you, understanding what the data means, and really getting you to ask the question, why is this out of spec? And then from there's working with your teams to better understand what levers can be pulled. The different scenarios and situations that may be coming about that's causing downtime and trying to get those items resolved.

Dan: Yeah. Well, and one thing I want to point out in this data is we do also capture conveyor idle time in those charts that we have down here at the bottom of the slide. So we also have the ability to say, okay, so we have some downtime, but conveyor idle time is significantly higher. So maybe that's something we need to look into. And this is where you use those NoPileups reports, the jumping off place, maybe this means this identifies one or two sites where you want to go shadow employees for the day. Or you've got a centralized video system and you're able to pull up video footage, just kind of watch operations either at the load on or the expertise and go what is different about this site compared to the rest? So again, just narrowing that focus.

Alex: Well, and also, I didn't mention it at the beginning and I, shame on me, I should have, but, you know, understand that these reports aren't just designed for the president or the CEO of the company, right? These are designed in such a way that you can have somebody at that level, but you can also have somebody who's a site manager and everything in between be subscribed to these reports. So I always kind of like to use the phrase, tag your team, bring your team in.

This is a configuration that you can basically have a set up as to what reports they get and what locations we're reporting on. But, you know, pulling in your site managers and saying, Hey, look, this is a metric, this is a KPI that we're using. I want you to drive home with your team that you know, downtime specifically, you know, downtime and within the categories, we want this to be below X value. So, you know, once again, we're now creating a KPI that is being measured in the same way every single time. And we can start setting standards and, you know, pulling our team along to meet the end goal.

Dan: Alright, so this is your second favorite child, Alex.

Alex: It might be. Yeah, absolutely. I love this one because we just have so many examples. We have worked with countless customers in trying to understand why stops are happening? Where it's happening and what it means, right? And then also the impact that comes from the conveyor stopping. So I like this one specifically because of the number of use cases and really great experiences we've had working with a lot of our customers to solve some obfuscated challenges that they have.

So NoPileup stops. This one seems pretty self-explanatory. I see a couple categories on here, like good and critical, prior week, report week. Of course we have the chart down there. Dan, give us your great overview of what we're looking at and how we can leverage some of this information.

Dan: Absolutely. So when we're looking at where NoPileups triggered stops occur, the big core question that we're trying to answer is, which locations have the most risk of having safety incidents? And is there something that differentiates that location from elsewhere? So now when we talk about good stops, there's situations where NoPileups detected problematic vehicle behavior and it stopped the conveyor, but there wasn't necessarily a vehicle close behind. Whereas when we look at those critical stops, that's saying, not only did we detect problematic behavior and we stopped the wash, but in addition to that, there was another vehicle that was close behind it.

So there was an additional layer of risk there. And as we jump into that graph down there at the bottom covering the total NoPileup stops at the site. This is one of those ones where we are really looking for the outliers on this chart, right? We're looking for the guy at the high end, we're looking for the guy at the low end. You look at that chart and you see that site nine over there on the far right hand side, you see that has a lot of NoPileup stops there. You'd think that I, as the NoPileups operations manager would be super excited because NoPileups is doing its job and it's adding a lot of value there. But when I look at that, the first question I think is why are so many stops occurring?

Dan: These are stops that are bringing value, but what are the underlying causes to those? And that's where, as we jump into some other of these charts, we can kind of dig into that.

Alex: You know, I kind of look at NoPileups like, and of course we, you know, NoPileups is going to do its job, it's effective at its job. But, I kind of liken it to a seatbelt, right? Just as a silly example, seat belts are great, they are effective, they do their job. But your hope is that you're never in a collision. You're never in a wreck. You're never in a scenario where you need to leverage that seatbelt. So as an operator, I'm looking at this and I'm saying, look, I'm thrilled. I have the NoPileup system in place. This is fantastic. But when I have a site that has four or five, six times as many NoPileup stops at a location, you know, and it's higher than the industry average, it's also, much higher than the rest of my sites, what's happening?

And are my risk increased at that location? And is it decreasing my efficiency at that location? Because there's more than one thing that's impacted there. So, I think that that's it's huge to be able to kind of look across the organization and get an understanding for the you know, pile up stops and the types. And you know, when we look at the, how many stops NoPileups is having at a specific location, the thing that you kind of go back to there is, well, that could be relative. Maybe site five is washing three times the volume. And that's where the chart that you have up on the screen, the vehicle's washed for NoPileup stop. That's where we're able to give you something, you know, that that would equate to kind of a ratio. So you now get to understand, you know, how one relates to the other. So Dan, you know, you got the chart here. Walk us through why this is useful.

Dan: Yeah, this is a huge tool especially for, you know, either organizations where you've got like rockstar sites and then you've got those ones that are still growing and you're trying to understand, like, I know my rockstar site has a lot of NoPileup stops, but that's 'cause they're running a lot of cars. So like comparatively speaking how many cars am I able to wash for every NoPileup stop that occurs?

And there are some challenges that are going to get harder and harder as you wash more cars, right? Equipment timing becomes more important, that load on becomes more important. But this can cut through all of that volume related noise and just say, at the end of the day, assuming we're all on a level play playing field, which one of these sites is actually washing the most cars per NoPileup stop. And we want that number to be as high as possible, right?

Alex: Yeah.

Dan: In a perfect world, I don't want NoPileups to stop your conveyor at all. I want you to be able to have a 1200 car day and have no problems at all.

Alex: Yeah, I mean, we want to have a the way that we operate here is that we want to be a business partner with our customers. So we have a product that is going to protect you. It is going to help increase operational efficiency. It's going to help generate more revenue because you can process cars more quickly. But at the same time, we want to make sure that you're using the seatbelt as seldom as possible because that means reduced risk for you and it it means higher operational throughput or operational efficiency and throughput, right? So, you know, leveraging this kind of data. Working with the NoPileups operations team, you know, if you have questions on it-

Dan: Yes.

Alex: That it's a tool and a resource that's available to you. It's just crazy not to leverage it.

Dan: Absolutely. We love those kinds of calls hearing from customers or emails where they're saying, Hey, I was looking at the numbers in my report and I have questions, tell me about this? That's the best calls we get all day.

Alex: So moving on to the next section here, this is going back to real life scenarios that we've dealt with on a whole number of occasions. The total NoPileup stops by camera and type, right? I have lots of words that I can say on this and what it means for you and why you care about this. Dan I'll let you kind of kick it off here and then maybe let's go into some of the examples that we've actually, you know, walked through with customers in solving.

Dan: Absolutely. Yeah, so on the previous rates, we got to see which sites have the most NoPileup stops overall. So we've got kind of our short list of who are the ones that I want to dive into a little bit more and get to the bottom of? So as we break this out on a per site basis, now we're going to be able to see, okay, at this site for this report period, where are the stops happening in the tunnel? Because when NoPileups calls for a stop, it's going to be tied to a specific camera and those cameras are named according to where they are in the tunnel. So, your second camera's probably going to be your wraps or you'll have another one in the rinse, you have another one in the blower.

So it's pretty obvious immediately, generally speaking, where in the tunnel the vehicle is when the stop is occurring. So from this chart on the top, I can see that camera two has significantly more NoPileup stops than the rest of my tunnel. So the question then becomes, well, what the heck are vehicles doing that are causing them to stop on camera two? And so when I drop down to the report below that, that's going to take that same chunk of NoPileup stops and say, what kind of a stop was it that occurred? You might ask, well, how do we know what kind of a stop was it that occurred? Well, that's part of what NoPileups operations does every time NoPileups stops the wash. We're going to record a short video of that, and then our technicians, real human people, are going to review that video and we're going to label it and say, Hey, I saw that car hopping a roller right there. That's what caused NoPileups to call for the stop. We do that right now about 70,000 times a month, and that data goes right back into this report. So based on these two pieces of data-

Alex: We're quite literally in part, helping build this data for our end users.

Dan: Absolutely.

Alex: You know, with the intent that they're gleaning insights from that, yeah.

Dan: Yep, yep. So I can easily see from this data camera two, which is probably the wraps camera has the most stops and the stops that are the most frequent are hop rollers. So from that I'm saying cars are hopping rollers on camera two. What could be causing that? Is it that customer behavior is not right? Maybe they didn't actually have their car in neutral, they had it in reverse or drive, and they're trying to fix that, getting into the wash and they're stepping on their brakes. Maybe there's something to do with the environment, right? Do I have tire brushes there? Are cars getting hung up on the tire brushes? Is there equipment there like wraps? The timing is very important. And if it's not quite right, there can be issues from that.

Alex: Yeah, I mean, you should always be, you should be questioning why I have tons of stops in a specific area of my tunnel, right? So going back to a real world example, we had a customer reach out to us and was just kind of scratching their head, I'm seeing a lot of NoPileup stops in this area. You know, I want to understand what's going on. How can we work together to figure that out?

And so as we went through the data, we combed through it. We identify what camera these stops are occurring on? More specifically, what types of stops are these? Then you're able to go back into the NoPileup system and actually review that footage yourself. We have that, we can provide that to you, but you can also pull that yourself. In looking over the footage, we identified that, well, we were able to provide the footage to our customer. He was able to review it, and he actually tagged in their maintenance team.

They went and inspected that area of the tunnel and found out that they actually had a conveyor problem in that area of the tunnel, and it was causing vehicles to constantly hop rollers, right? And in response to that, NoPileups is triggering stop. So NoPileups was doing its job. It was performing quite well. It was saving their bacon time and time again speaking candidly, but investigating why NoPileups was having to jump in. Why we're having to be that seatbelt again, led them to identify that there was actually a problem that was increasing their risk and really reducing their operational efficiency.

So by solving that, we were able to drop the stops down at that site pretty dramatically. But, perfect example, leveraging the NoPileups data, reading it, understanding it, starting that investigation process, you know, and then taking action for the end result that you're looking for. So yeah, I mean, here's the chart of kind of before changes and after changes in side by side comparison, yeah.

Dan: It's pretty crazy looking at the numbers. I mean, if you're just comparing these visually, you think, oh, well this hopped roller number is still pretty high for both of them, but notice that those NoPileups reports, the scale on here is dynamic based on the number of stops. So before the changes, we were getting literally 50 hopped rollers, both the report week and the current week, which tells me that this is not a fluke, this is not a one-time thing. This is very consistent.

Dan: And then after we've implemented the changes, kind of given it a couple weeks to percolate, look at where we're at now instead of 50, we're at 8 total for the entire tunnel.

Dan: And that's consistent report week versus previous week.

Alex: Well, and I mean-

Dan: It's huge.

Alex: Yeah. It's a big deal, right? Because again, that feeds into your downtime. Every time the conveyor stops, there's loss efficiencies there, right? So, you know, another great example of this is the exit.

Dan: Yep.

Alex: We've worked with customers in the past where they've had a lot of stops at their exit. They're trying to understand what man, this is killing me. What's going on? Well, in digging into the data, identifying that stops are occurring at the exit, reviewing the footage. It was actually identified that my stop go light or my wait go light at the exit, the timing was all messed up. And it wasn't telling customers to pull out soon enough. So even making a small change like that, reduce the exit stops by something like 40%. I mean, it was just crazy, right?

Alex: And it all starts with just looking at the data, and then tagging in your team and starting that investigation process, understanding where to spend your time. And when you look at a report like the set of reports we're able to provide you, you know, as an operator, like I said earlier, you only have so much time in the day as a site manager. You only have so much time in the day. These reports allow you to identify where you focus some of those efforts, what sites are doing well? What sites could use a little bit more attention? And then you can hone in even deeper and say specifically, what at those sites can I be doing to improve operations?

Dan: Well, and I think your call out here, Alex, of don't underestimate your exit, basically is a huge one.

Alex:Yeah.

Dan: Right, because especially for operators that run high volume and depending on your lot layout, like is what's holding you back from running an extra 25 cars on a Saturday, the line to your vacuums? Is there something that you can change operationally in order to make that work better? Is there revenue that you can tie to that to help make the case for change? Right? Do do I need extra resources? Do do I need to change the timing on that go light in order to make things work? Heck, is it even just something as simple as the slope of my exit driveway?

Alex: Yeah.

Dan: Little things like that can make a world of difference.

Alex: Yeah, I mean, again, you know, I think it's easy for us to sometimes look at the exit and say, well, yeah, people lollygag, they don't pull out, they're on their phone, what have you. Don't allow yourself to always chalk it up to that. Take a look at the data, investigate, ask questions. How can I make sure that customers are pulling out? Yes, you're going to always have those customers who are a little delayed and they slow down the line, but how do we minimize that? Right? And I think when you take this data, you look at it, you start asking those questions, that's where you unlock the ability to move to the next level.

Dan: Yep. Yeah. And this is a great example. We talked about our smart exit solution earlier. This goes back to how many times is that engaging, right? So how many times are you having issues at your exit chunked out by the time of day when it occurs? So what are the times of day when you have the most issues? If it's really uniform, to me that indicates that it's not a volume-based issue, it's more of customer behavior issue. And that's not one of those things where we could just wipe our hands and say, ah, well customers will be customers. What assistance can we give them? You know, can we get gravity to work in our favor here to keep that conveyor moving and keep the money coming in?

Alex: Just to we talked about the smart exit. Smart Alex. We talked about the smart exit functionality, and how it's more intelligent than your standard and collision pad. And these are some of the things that we're talking about this exact type of thing. All right, I think our last section here.

Dan: Yes.

Alex: And this really gets into the side-by-side comparisons and you know, what that can tell you. So understanding that, again, we have a lot of charts. A lot of graphs on the screen. I'm not expecting you to be able to see each individual graph. What we're really trying to highlight is this is what we call our organization summary. So if you're in some if you're in a leadership position of the organization, you might want to get an org summary report. So Dan, what with the org summary, what am I getting out of this?

Dan: So this, we're not going to be punching into like, where are the stops occurring at individual sites, right? This is meant as a two page report that we can either attach to the beginning of a really thorough report so that you have a starting place to dive deeper or, you know, if you're someone who's very high level and you just need a glanceable thing to look at, this has a lot of information. Compares, things really close. If you have a lot of sites in your organization, it'll just say, the top 10 sites for this metric and the bottom 10 sites for this metric.

You got fewer sites in your organization. It's going to have a side-by-side comparison of every single one. And the main goal here is to identify which of the ones that are underperforming? Which of the ones that are overperforming? And then use that information and either say, Hey, manager at site 12, I need you to go look into this. Or Hey, this is when I break into a focus group with my regional manager and say, Hey, let's try to focus this a little bit more and see what we can do to move these numbers, but not get lost in the minutia of individual data for 10 sites.

Alex: Yeah, absolutely. So, we talk about it at a larger organization level, right? And you know, so you send manager of site five off to do a little bit more digging. I think that's where we can move into the site view. So again, this is the org view. Now we can come to the location summary, right and the site view summary. So Dan, what are we seeing here? I mean, we've looked at all the individual graphs. Go ahead.

Dan: Well, and in fact we're looking at the location summary. So this is something we added because you know, as a lot of organizations are growing, you have those district managers, right?

Alex: Yeah.

Dan: So they're a part of the bigger organization, but they don't have control over the whole organization. They have a certain subset of locations as they specialize in. So this lets them get that organization view if they want, so they can see the best of the best across the organization. But this punches in and says, okay, district manager for the five sites you're responsible for, here's how they compare regardless of how they are in the overall organization.

See which ones of those are good, see which ones of those need a little bit more work. And again, have those comparison lines for the organization averages. So it's really easy to see, yeah, this one site is a real rockstar, but the rest of my locations are right at the organization average. So maybe that's not where I spend my time, or I go, oh my gosh, those guys are really below where the rest of the organization is at. That's where I need to call on the cavalry and really dig in deep.

Alex: Yeah, so district managers, right?

Dan: Yes.

Alex: Area managers, this is the report for you. You get the opportunity to see the larger organization view, if that's what you know, you need, but really being able to say, okay, that's great and dandy, but I need to focus my efforts on my specific locations, in a region or however they're laid out. This is the report that is this, it's built for you, right?

Dan: Yep, and then we don't have a slide for it, but I did want to touch on it because you mentioned it. Beyond this, we also punch in to an individual site view, and that's three pages that is dedicated to this one site in particular. And the great thing about the NoPileups reports is they're super customizable. So if you've got some people that it really makes sense to dive deep into individual locations for, we can get them that. If you've got other people where you just want to give them the top line highlights and they can drive change that way we can get them that too. This is highly customizable to individual people and it's the same cost regardless of whether you've got one person signed up for it or 50 people signed up for it.

Alex: Yeah, so, I think that Dan, that actually takes us kind of right into the next slide here. I'm not sure that we have a slide for it, but, for those of you who are existing NoPileups customers, if you're not getting reports, how do you get reports? And what's the effort? What's the cost? All these other things. The great thing is, it's a freebie. It's included. This is part of the service. There's no additional add-on. You can reach out to our NoPileups support team. You can contact them at, you know, support@nopileups.com. Super responsive and just let them know that you want to get signed up for NoPileups reports.

We'll ask you how many people you want to get signed up? Email addresses, those types of things. We'll get you enrolled and you can start taking this data and turning it into insights almost immediately. These reports, they are sent out once a week, every Wednesday they'll be in your inbox ready to go. And at any time you can contact us and have us go through a deep dive with you. We are happy to do that. It's part of the service that we offer. You know, if you're not sure how to take the data or how to read the data or take action based on the data, give us a call. Let us talk to you about it. We get excited about this stuff. So, you know, we're happy to jump on this. I know that we're kind of coming up on time here. We're just a little bit over. I do have a couple questions that I see, but let's see. So Dan, we have a question here that is.

Alex: For average gap at peak traffic is this graph telling us that cars are loaded with 20 or so feet between each car?

Dan: That's great. Let me just jump back here. Average gap at peak traffic. Yeah. So let me jump into this graph just a teeny bit more. So yes, the answer to the question is this graph telling us how close in feet cars are loaded? That's correct. So these bars, these vertical bars here are telling us the average number of feet between vehicles that are loaded. So this is saying that on Sunday of this week, during that day, the average for vehicles loaded again, during the peak hours was 25 feet bumper to bumper. It's also saying that the week prior to the report, it was about 20 feet.

And we can also see from this that the org average for a Sunday for both the report week and the week prior was also around 20 feet. So from this, I can say that as an organization on Sundays we're about at 20 feet and this location is right in that zone. So that's where I would say, yeah, that location, they're not setting any new standards, but they're by no means deficient.

Dan: If we take a look at this bottom chart here, we can see this is a comparison side by side of these sites, and this is saying, taking our peak times across the week, what's our average spacing? And so we can see here that site three, kind of in the middle, the spacing there is significantly lower. And so that's like, Hey, those guys are really kicking butt. I wonder what they're doing at that location that's a little bit different than site number eight. And is that something that we can stretch across the rest of our org?

Alex: Perfect, so the other question that I had here, and I can answer this one real quick. It looks like some of the graphs are average downtime, average gap and so on. Most of them are a week over week comparison. The question is, are we able to pull data beyond that week over week? Right now the reports are set static, week over week. That is a feature that we have in our backlog and is on the roadmap. We want to expand that capability. There's lots of improvements that we are looking to add for customization to some of these reports. So it's a great ask, it's a great question, and it's something that we are actively working towards being able to provide to you.

Dan: Well, I think it highlights, one of the things that's pretty exciting to me about this, Alex, is this is not something that's set in stone, and this is all the data that we're ever going to have. This is something that we've developed in partnership with some of our customers and asking, Hey, what are the data points that are meaningful to you? But everybody's operation is different. So if you come back and you look at these reports and go, man, I really wish I knew more about this. We're always looking for new ideas to things to add to this or future insights that would allow this to crank the value for customers even up to the next notch.

Alex: Yeah, absolutely. Right on point with that, Dan. So again, I know, I know we ran a little bit over on time. You get into this data stuff, you get into the reports, it's easy to just continue talking and talking and talking about it. I had a great time, you know, working with everybody here and answering some of these questions that you had. And hopefully you're able to take something out of this and really, you know, learn how to leverage the data that NoPileups can provide you and turn that into action and really understand that looking at that data is just the beginning of that investigation. You know, and like I said before, don't be afraid to tag your team in on this data.

They will appreciate having some consistent KPIs that they can look at. And, you know, most site managers I talk to they're excited about figuring out how to be more efficient and addressing some of the things that they're running into. So thank you for your time today. Thanks for jumping on. If you have any more questions, feel free to reach out to us. If you're interested in signing up for NoPileups, contact your sales rep and they can get you all the information you need. If you have NoPileups currently but are not subscribed to reports, again, you can reach out to our support team by emailing support@nopileups.com. I hope everybody has a great rest of your day. Thank you again for joining.

Related Content

image of person receiving emails

Blog Post

Email & Text Messaging Best Practices

November 18, 2024

Email and text messaging offer unparalleled opportunities to foster customer loyalty and accelerate wash plan membership growth.

Read more
back of a vehicle going through a car wash tunnel

Case Study

NoPileups™: Canton Car Wash's "Secret Weapon"

November 12, 2024

Learn how NoPileUps™ and Canton Car Wash work together to reduce damage claims, increase throughput and maximize revenue. 

Read more
image of a tree split in four frames showing it in spring, summer, fall and winter

Blog Post

4 Seasons of Social Media Marketing for Car Washes

October 22, 2024

Each season of the year provides opportunities for car wash operators to deploy creative social media marketing campaigns.

Read more
Translucent arrow decoration

Request a NoPileups Demo And Information on New, Lower Pricing. 

Not ready for a demo? Subscribe to our newsletter!

Air bubbles in blue water