Learning Library


Webinar
June 30, 2026
Patheon updates, operational visibility, staff efficiency, and the customer experience. We’ll also preview what’s on the roadmap for Q3
Blog Post
June 25, 2026
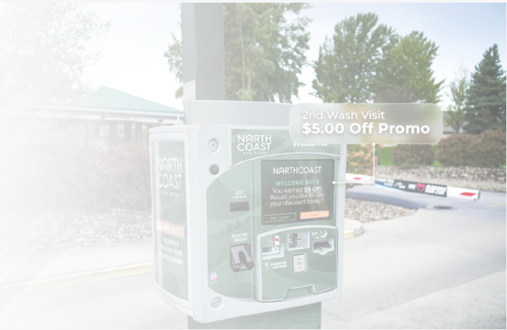
Patheon Personalized Promotions is a new feature within DRB's Patheon platform that enables car wash operators to deliver
Webinar
Webinar: Quarterly Innovation Outlook: What's New & What's Next in Patheon
April 8, 2026
Patheon updates, operational visibility, staff efficiency, and the customer experience. We’ll also preview what’s on the roadmap for Q2
Read more
Webinar
Webinar: Unlocking Growth: Smarter Retail Strategy & Promotions
March 2, 2026
Optimize timing with seasonal and weekly promos, boost growth with holistic offers (gift cards, coupons, partnerships), retain customers via PAYGO
Read moreBlog Post
The Benefits of a Mobile App Directly Integrated with Your POS
December 11, 2025
Patheon and Beacon work together to make membership management simple and seamless.
Read more
Webinar
Webinar: Unlocking Growth - Using Data to Reduce Churn and Strengthen Memberships
November 11, 2025
A deep dive into how DRB’s data intelligence helps car wash operators reduce churn and optimize memberships.
Read more
Webinar
Webinar: Loyalty, Speed and Predictable Revenue - Fueled By Washify
October 1, 2025
In-Bay operators face unique challenges: unpredictable income, limited staffing, and slow throughput. Washify was built to solve these problems, de
Read more
Webinar
Webinar: From Spooky to Sparkly: Holiday Campaigns That Work
September 11, 2025
In this webinar, the Suds team for a fresh take on holiday promotions, where we’ll break down three proven campaigns and how to make...
Read more